Additionality for Reforestation Projects, Explained with VM0047
What additionality means for a tree-planting carbon project, how Verra's VM0047 tests it for area-based and census-based projects, with pass and fail examples.

Additionality means the carbon would not have been removed without the money from carbon credits. For a reforestation project, that is a question about trees: would they have grown back, or been planted, anyway? Verra's VM0047 methodology answers it with four demonstrations: regulatory surplus, a performance benchmark, an investment analysis and common practice. Which ones a project needs depends on how it counts its trees. Area-based projects re-prove additionality at every verification against satellite control plots. Census-based projects prove it with a common-practice test and an investment analysis.
Restoration Scope, which makes field software for carbon projects, wrote this guide from VM0047 version 1.1 (14 May 2025) and the VCS Standard, in our own words. Checked November 1, 2026. To run the numbers on your own project, use the  VM0047 additionality calculator.
Which tests does a VM0047 project take?
VM0047 has two ways to count trees, and each comes with its own additionality method (Section 7). Area-based projects measure sample plots across the planted area and use a performance method. Census-based projects count every planting unit and use a project method. Census-based is for direct planting of up to 50 planting units per hectare on land that keeps its previous use and has under 10% woody cover or is cropland, settlements or "other land", such as trees on farms (Section 4.3 lists every condition). A project planting 50 or fewer units per hectare that could use census-based may not use area-based (Section 4.4.1).
| Test | Area-based | Census-based | Checked at |
|---|---|---|---|
| Regulatory surplus | Required | Required | Validation and each crediting period renewal, plus any verification that reassesses the baseline (VCS v5.0) |
| Performance benchmark | Required | Not used | Validation as a forecast, then every verification |
| Investment analysis | Conditional | Required | Validation |
| Common practice | Not used | Required | Validation, with data from within five years of the start date |
An area-based project runs the investment analysis only if it has revenue or financial incentives other than carbon credit sales (Section 7.1, footnote 10). The investment analysis follows Step 3 of Verra's VT0008 tool, by one of two routes: an investment comparison showing the project would not be the most economically attractive option without carbon credit revenue, or a benchmark analysis showing it would not meet the required financial benchmark without that revenue, both tested with a sensitivity analysis (VM0047 Section 7.3.3). Under the benchmark route, a project that can't also show carbon revenue decisively lifting its returns to the benchmark is still additional, but may not be eligible for the ICVCM's Core Carbon Principles labels (VT0008 Section 5.4.2).
Sources: VM0047 v1.1 Sections 4.3, 4.4.1, 6.2, 7.1 to 7.3 and footnotes 10 and 11,
VT0008 Additionality Assessment v1.0 Step 3 (Sections 5.4.1 and 5.4.2),
VCS Standard v4.7 Section 3.14.1,
VCS Standard v5.0 Section 3.13.1. Checked November 1, 2026.
Area-based: the performance benchmark, step by step
The performance benchmark asks whether land in the project gained tree cover faster than similar land outside it. It is measured with a stocking index: a remote-sensing metric, such as a normalized difference fraction index from Landsat, LiDAR canopy height or canopy cover from aerial imagery, that is significantly correlated with aboveground biomass in published or peer-reviewed studies, or validated with direct measurements from the project's ecoregion. The steps are in VM0047's Appendix 1:
- Project plots. Divide each year's planted area (each annual cohort) into equal, contiguous, non-overlapping units of 0.01 to 10 hectares, each at least 75% inside the project boundary, and draw a representative random sample of at least 30.
- Donor pool. Mark out where control plots may come from: the same jurisdiction (the country, unless the project sits in a subnational jurisdiction registered under Jurisdictional and Nested REDD+ or delineated by government for REDD+ reporting, no lower than the second administrative level), the same ecoregion at biome level, the same government tree-planting incentives, the same land tenure classes (at least public or private), and within 100 km of the project plot's centroid. Areas inside registered AFOLU projects may be left out. Datasets must be 30 m resolution or finer, and at least as fine as the project plots.
- Matching. For each project plot, pick the k control plots whose stocking index was closest at three or more points before the start: one between 10 and 8 years before, one between 8 years and 1 year before, and at the start. Each control plot is matched to one project plot only.
- Match check. The match is valid when the standardized difference of means for every covariate is 0.25 or less. If not, widen the donor pool in 100 km steps or take fewer controls per plot, and try again. The controls are then fixed for the crediting period.
- Monitoring. Read the stocking index on all plots at least once a year, and update the benchmark at each verification or every five years, whichever comes first. Drop control plots that have since come under a subnational government tree-planting incentive the project isn't part of, and replace them from the donor pool.
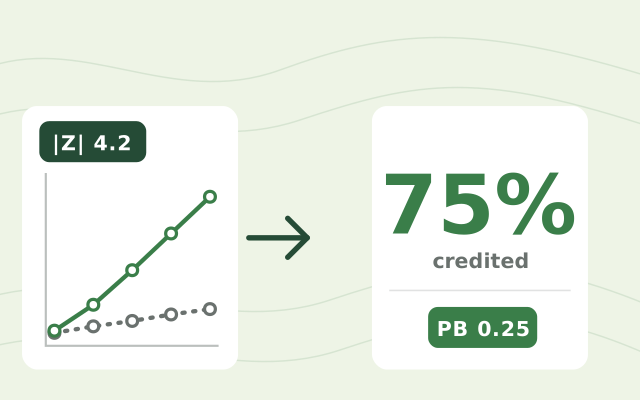
- Slopes and Z test. Fit the yearly increase in stocking index (the slope) for project and control plots across every year since the start, then compare them with a Z test. They are significantly different when |Z| is 1.96 or more.
- Benchmark. If they differ, the performance benchmark is the control slope divided by the project slope. A control slope that is not significant (P above 0.05) or below zero counts as zero. If they don't differ, the benchmark is 1.
The benchmark then scales the carbon your field plots measured. Equation 32 takes the smaller of the measured stock change and the stock change × (1 − benchmark), applies the uncertainty deduction, and subtracts project emissions and leakage. All of these are counted from the start, so it then subtracts the previous verification's full result, worked out the same way. In the benchmark, the satellite data never sets how much carbon there is: Appendix 1 says remote sensing is used only to estimate relative change between project and control plots, and the carbon comes from field measurements. (Two limited exceptions: where woody biomass was cleared before plots could be measured, and no other significant carbon pool was affected, a remote-sensing estimate of it may be used, Section 8.2.1.2; and a stocking index may serve as the auxiliary variable in two-phase field sampling, Section 9.)
In symbols, for the verification ending in year t; Equation 32 then subtracts the same terms for the previous verification, t − x:
VM0047, eq. 32
At validation there is no monitoring yet, so the project forecasts the benchmark: control-plot slopes from the 10 years before the start against the project's expected growth curve (Section 7.3.2 and Appendix 1, A1.3).
Sources: VM0047 v1.1 Sections 3 (stocking index), 7.3.2, 8.2.1.2, 8.5.2, 8.6.1 Equation 32, 9 (aboveground woody biomass), Appendix 1 Sections A1.3 to A1.5 (Steps 1 to 6, Table A1, Equations A7 and A8, the stocking index parameter table). Checked November 1, 2026.
A worked example: pass and fail
The numbers below are made up to show the arithmetic. Your remote-sensing provider reports the slopes and their standard errors.
Pass. Project plots gained 0.04 stocking index a year (standard error 0.006); control plots gained 0.01 (standard error 0.004).
- Z = (0.04 − 0.01) ÷ √(0.006² + 0.004²) = 4.16. |Z| is above 1.96, so the slopes differ.
- The provider's regression gives the control slope a P of 0.05 or less, so it counts. Here it is 2.5 standard errors from zero; with only a few years of data, the regression's own P-value decides. Benchmark = 0.01 ÷ 0.04 = 0.25.
- Field plots measured 12,000 t CO2e of stock change, with a 90% confidence half-width of 18%. The uncertainty deduction is the half-width minus 10 percentage points, kept between 0 and 100%: 18 − 10 = 8%. Above a 100% half-width, nothing is credited (Section 8.5.2).
- At a first verification, removals before project emissions and leakage are:
VM0047, eq. 32
Fail. Same project, but control plots gained 0.032 a year (standard error 0.006): the land around the project was regrowing almost as fast.
- Z = (0.04 − 0.032) ÷ √(0.006² + 0.006²) = 0.94. |Z| is below 1.96: not significantly different.
- The benchmark is set to 1, so none of the 12,000 t CO2e counts. At a first verification the result is zero less project emissions and leakage; right after a credited verification, Equation 32 subtracts that verification's result, so it is negative.
A fail is not final: the next verification runs the test again with every year of monitoring so far. If control plots grew significantly faster than project plots, the benchmark goes above 1 and the result is lower still.
Census-based: surplus, investment and common practice
A census-based project can set its baseline to zero, as long as woody cover was under 10% before planting and the land was continuously cropped, a settlement or "other land" (Section 6.2). It then demonstrates additionality three ways: regulatory surplus, an investment analysis (always, for census-based projects) and common practice.
The common-practice test (Section 7.3.4) asks whether landowners like yours already do this without carbon money:
- Define the activity. For example, tree planting.
- Set the area. Start from the national border, then narrow it where national or subnational programmes give different incentives, to match the project's incentives and market (for example, distance to nurseries or wood processing).
- Set the class of adopters. For example, smallholder farmers.
- Name any essential differences. List what sets your project apart from similar activities: new barriers, ended subsidies, changes in access to land or inputs, markets, labour, climate, slope or soil. Each must be verifiable.
- Measure adoption. Use a representative survey of similar landowners in that area, or statistics on ARR activities that are relevant to the project area and publicly available: an agricultural census or other government data, peer-reviewed studies, or independent reports by industry associations with transparent methods. Statistics don't separate carbon-financed activity, so they count all adopters, which is conservative. Either way, the data must be collected within five years of the project start date.
- Count the adoption rate. From a survey, take the share who do the activity without carbon finance revenue, for example landowners outside any registered VCS forestry and land-use (AFOLU) project.
Below 15% adoption, the activity is not common practice. At 15% or more, it is, and the project is not additional. For example, surveying 120 farmers and finding 11 planting trees on their own gives 9.2%, a pass. Finding 24 gives 20%, a fail.
Sources: VM0047 v1.1 Sections 6.2, 7.2, 7.3.3, 7.3.4 and footnote 11. Checked November 1, 2026.
Regulatory surplus and timing
Both approaches must show regulatory surplus under the VCS Program's rules (VM0047 Section 7.3.1). Two versions of the VCS Standard apply for now. Projects may use version 5.0 already; for most of its requirements, including regulatory surplus, it applies to requests submitted from 1 July 2027, and some requirements have their own dates.
- VCS Standard v4.7 (Section 3.14.1): shown at validation and each crediting period renewal. No law, statute or regulatory framework may mandate the project activity; in UNFCCC non-Annex I countries, no systematically enforced one. The VCS Methodology Requirements v4.4 (Section 3.5.3), which go with v4.7, add that in non-Annex I countries, policies since 11 November 2001 that favour less emissions-intensive activities need not be counted, and in all countries, policies since 11 December 1997 that favour more emissions-intensive ones are not counted. Version 5.0 of the Methodology Requirements drops these date rules and defers to the VCS Standard.
- VCS Standard v5.0 (Section 3.13.1): also shown at verifications that reassess the baseline. In high-income countries (World Bank classification), no law or regulatory framework may mandate the activity; in all other countries, no systematically enforced one, shown with authoritative, up-to-date information. Laws that explicitly allow carbon credits to be used, for example to report impact or enforce the law, don't count against it.
Timing matters too. The ICVCM's Core Carbon Principles ask carbon-crediting programs to show that carbon finance was considered before a project started (criterion 8.3), through dated evidence from before the start date, a time limit between the start date and validation, or both. The VCS Standard sets time limits, which differ by approach and version. Under v4.7, a census-based ARR project, which uses a project method, starts the pipeline listing process within three years of its start date and completes validation within eight. An area-based project uses a performance method, so it starts the listing within those eight years and may complete validation as late as its first verification (v4.7 Sections 3.8.2, 3.8.3 and 3.8.7). Under v5.0, a pipeline listing request submitted from 1 July 2027 is due within one year of the initial crediting period start date, and an ARR registration request within eight years of it (v5.0 Sections 3.8.2 and 3.8.3).
The ICVCM approved VM0047 version 1.0 on 11 December 2024 and version 1.1 on 18 September 2025. The ICVCM's non-binding observations on version 1.0 record that empirical testing of the area-based approach had not yet been conducted, and say programs should oversee how validation and verification bodies (VVBs) apply it.
Sources: VCS Standard v4.7 Sections 3.8.2, 3.8.3, 3.8.7 and 3.14.1,
VCS Standard v5.0 Sections 3.8.2, 3.8.3 and 3.13.1,
VCS Version 5 overview of program updates and effective dates (updated 27 October 2026),
VCS Methodology Requirements v4.4 Section 3.5.3,
Verra: new effective date for VCS Version 5 (27 October 2026),
ICVCM Assessment Framework v1.1 criteria 8.1 to 8.4,
ICVCM decisions VCS_VM0047_v1_2024 and M44_VCS_VM0047_v1.1_2025,
ICVCM observations on ARR methodologies (December 2024) Sections 3 and 4. Checked November 1, 2026.
Before validation: a self-check
Some of this evidence can only be made early, like dated records and plots measured at the start; the rest is due by validation. Check you hold it:
- Legal review. A dated review of the laws that apply to the activity and, where the test is "systematically enforced", evidence of how they are enforced.
- Timing. A documented start date, the listing and validation deadlines that apply to your approach and VCS version, and dated records of when carbon finance entered the plan.
- Boundaries. The project area and each annual cohort as clean polygons, so project plots can be drawn inside them.
- Remote sensing (area-based). A provider for the stocking index, the donor pool rules and the matched controls with their match check, documented so a VVB can repeat them.
- Adoption data (census-based). The activity, area and adopter class defined, and answers from a representative survey, or qualifying public statistics, collected within five years of the start.
- Finances. The VT0008 Step 3 investment analysis, needed for census-based projects and for area-based ones with revenue or financial incentives other than carbon credit sales.
Where software fits
Additionality is decided by the numbers above, but a VVB checks them against records: where the plots are, what was planted and when, and what the landowners said. Those records come from the field, often over years and across many teams.
Restoration Scope Field keeps them. Plots and trees get their IDs, GPS points and photos, recorded offline. A field form can hold each surveyed landowner's answers with a photo and a point on the map. Tables export as CSV for your VVB and your remote-sensing provider. We don't produce the stocking index, run the Z test or write the investment analysis, and we don't decide whether a project is additional; that is your VVB's job.
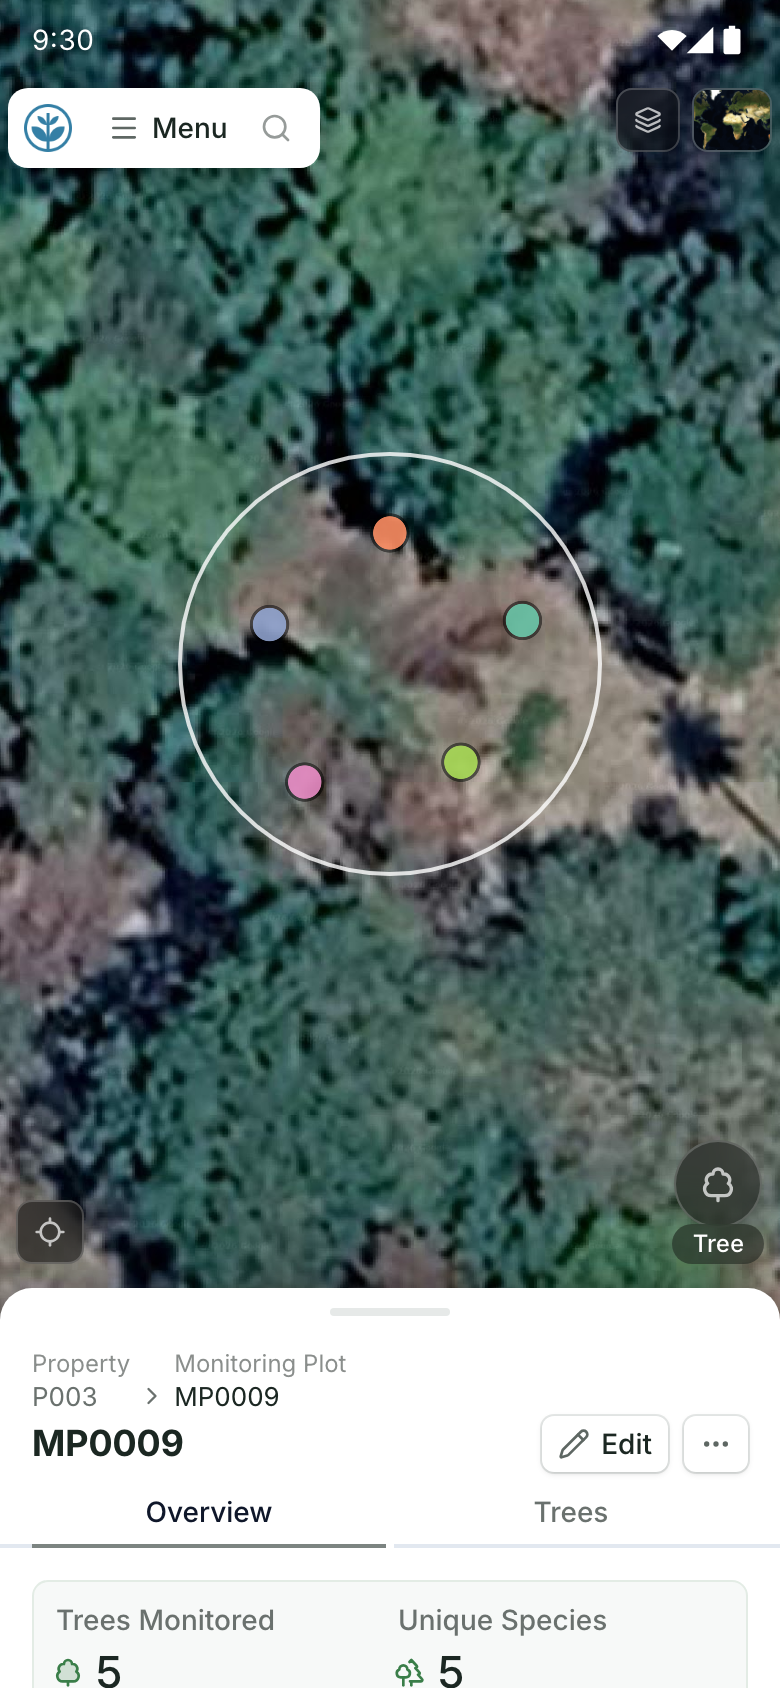
A monitoring plot on a phone.
The plot on the map with each tree recorded inside it, and the plot's record below. Demo project: names and numbers are made up.
More guides: what VM0047 asks you to record, getting VM0047 records ready for verification and compare carbon standards for nature projects.
Disclosure: Restoration Scope makes field and monitoring software for carbon projects. We are not a validation or verification body (VVB), and we don't issue credits or decide whether a project is additional.
Questions about additionality
What does additionality mean in carbon credits?
That the carbon a project removes would not have been removed without the money from selling credits. For a reforestation project: the trees would not have grown back, or been planted, anyway. A credit for removals that would have happened regardless pays for nothing.
How does VM0047 test additionality?
Four ways, depending on the approach. Area-based projects show regulatory surplus and pass a performance benchmark, comparing satellite growth on project plots against matched control plots at every verification, plus an investment analysis if they have revenue or financial incentives other than carbon credit sales. Census-based projects show regulatory surplus, an investment analysis and that the activity is not common practice.
Can a project that passed additionality at validation fail it later?
Yes, under VM0047's area-based approach. The Z test runs again at every verification. If project and control plots no longer differ significantly (|Z| below 1.96), the performance benchmark is set to 1 and no growth counts. Because Equation 32 subtracts the previous verification's result, a fail right after a credited verification gives a negative result.
What adoption rate counts as common practice under VM0047?
15% or more. A census-based project measures how many similar landowners in its area already do the activity, with data from within five years of its start date: from a representative survey, counting those without carbon finance, or from qualifying public statistics, which count all adopters. At 15% or more, it is common practice and not additional.
Is a project that a law requires additional?
No. The VCS Standard requires regulatory surplus. Under version 4.7, which applies to registration and renewal requests submitted before 1 July 2027, no law or regulation may mandate the activity, or in UNFCCC non-Annex I countries, no systematically enforced one. Version 5.0 draws that line at high-income countries instead, and disregards laws that explicitly allow carbon credits to be used.
Does Restoration Scope run the additionality test?
No. We keep the field records a project's evidence rests on: plots, trees, photos with GPS and landowner survey answers. The stocking index comes from a remote-sensing provider, and your validation and verification body decides whether the project is additional.
Another question? Email us or book a call.